-
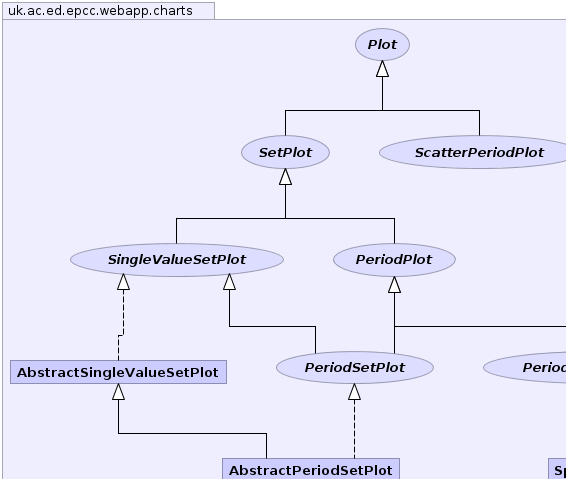
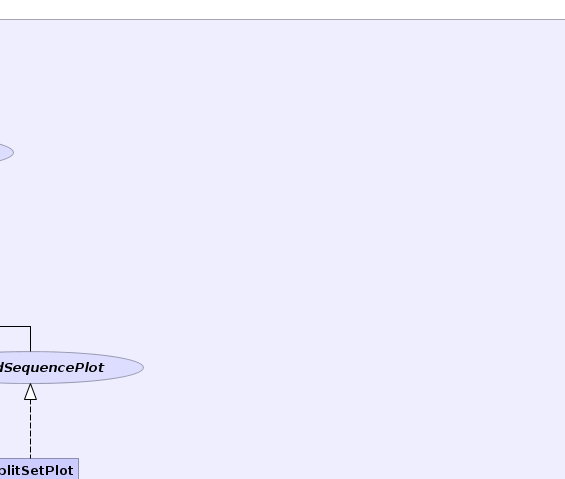
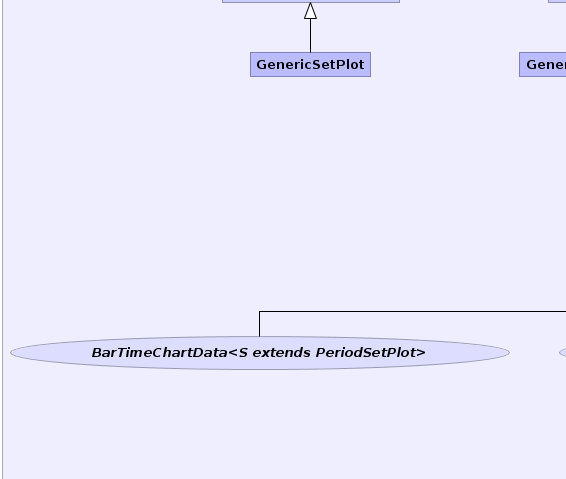
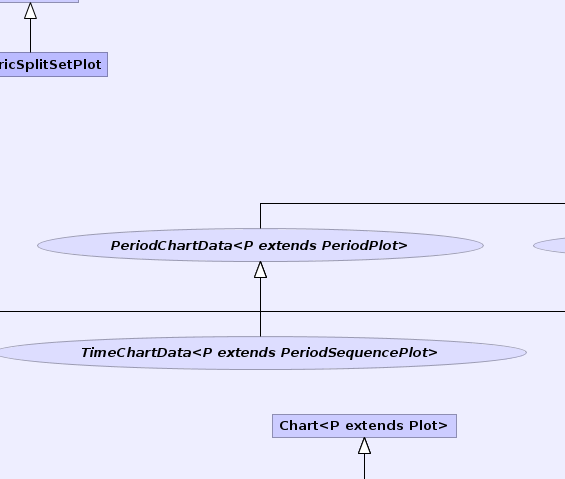
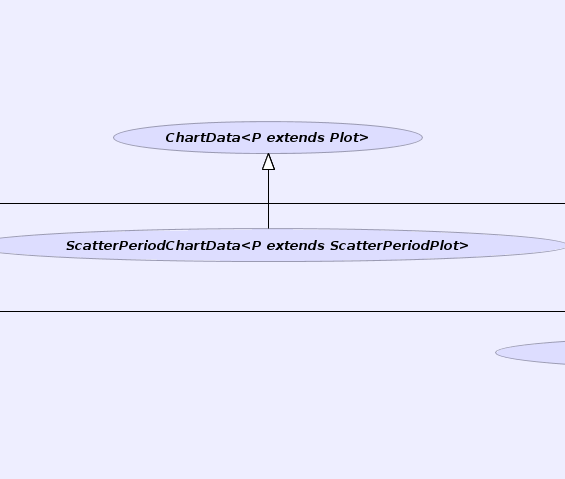
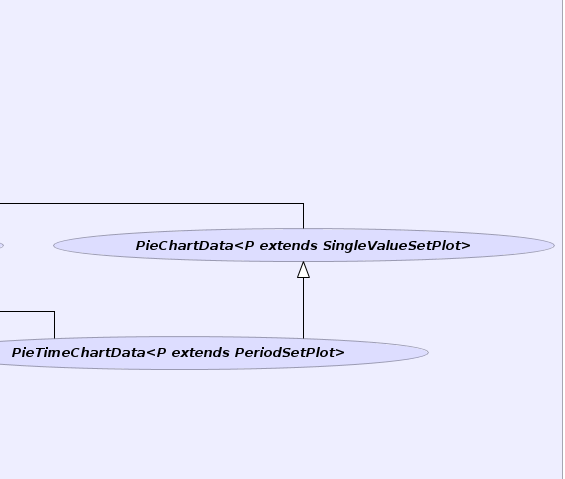
Interface Summary Interface Description BarTimeChartData<S extends PeriodSetPlot> ChartData<P extends Plot> Interface for objects that represent the actual Chart graphic Objects implementing this interface are intended to be the graphic-library internal implementation of chart objects.PeriodChartData<P extends PeriodPlot> PeriodPlot ASetPlotwhere each data value in a set corresponds to a period of time.PeriodSequencePlot Each set of data consists of a sequence of time periods.PeriodSetPlot PieChartData<P extends SingleValueSetPlot> A ChartData that represents a PieChartPieTimeChartData<P extends PeriodSetPlot> Plot A class representing plot dataScatterPeriodChartData<P extends ScatterPeriodPlot> ScatterPeriodPlot SetPlot Plot represents the Data in the chart being created.SingleValueSetPlot This is a Plot where each member of the set only contain a single value.TimeChartData<P extends PeriodSequencePlot> A ChartData that represents a TimeChart -
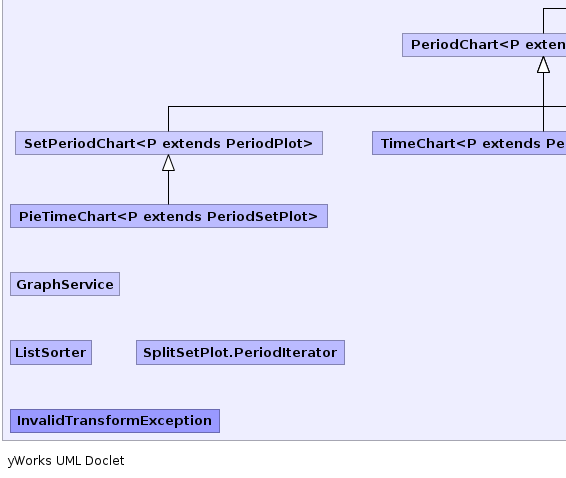
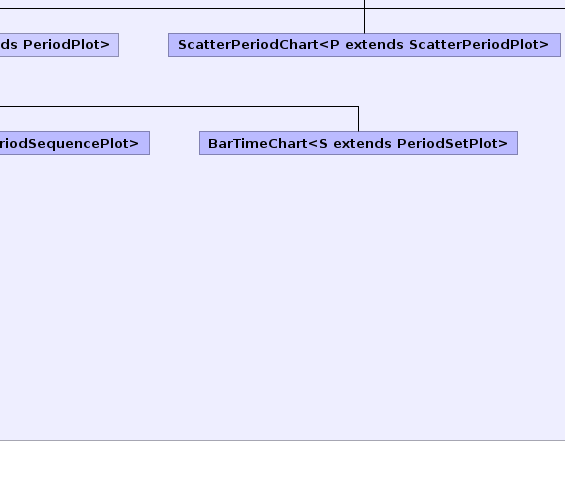
Class Summary Class Description AbstractPeriodSetPlot AbstractSingleValueSetPlot This is a abstract superclass forSingleValueSetPlotthat implements the methods fromSetPlotvia the additional methods inSingleValueSetPlot.BarTimeChart<S extends PeriodSetPlot> BarTimeChart This is the bar chart equivalent of a TimeChart and is functionally equivalent toPieTimeChart.Chart<P extends Plot> Chart is a base class for chart generation.GenericSetPlot generic version of plot for use where the underlying data-model of the graphics class is radically differentGenericSplitSetPlot generic version of plot for use where the underlying datamodel of the graphics class is radically differentGraphService AnAppContextServicethat selects the desired chart implementation classesListSorter ListSorter sorts an array of indecies according to the values in an arrayPeriodChart<P extends PeriodPlot> PeriodChart is aChartwhere the data represents a plot over some period of time.PieChart A basic piechart where the data comes from a Table or MapPieTimeChart<P extends PeriodSetPlot> PieTimeChart This is the PieChart equivalent of a TimeChart It plots the sum of quantities over a period and uses the same mapping classes the intention is that you can use this to generate piecharts and timecharts interchangably.ScatterPeriodChart<P extends ScatterPeriodPlot> AScatterPeriodChartis a scatter plot where each point is generated by a different time period.SetPeriodChart<P extends PeriodPlot> PeriodCharts that represent a set of values such as a pie-chart of bar-chart.SplitSetPlot A SplitSetPlot is aPeriodSequencePlotwhere the data is split over a series of time periods The time periods are divided into Major/Minor sub-divisions called Catagories and Items.TimeChart<P extends PeriodSequencePlot> A helper class used to make graphs Basic constructors define the time range, We then use call methods that add additional plots these return thePeriodSequencePlotso we can add data with the addData methods. -
Exception Summary Exception Description InvalidTransformException Exception thrown when a problem occurs mapping data to a plot
Package uk.ac.ed.epcc.webapp.charts Description
Package of helper classes for the generation of charts in a web-application
The main classes are independent of the graphing package used. Each chart class contains a
class implementing the ChartData interface which contains the package specific code.