-
- Type Parameters:
P- Type of Plot
- All Superinterfaces:
- ChartData<P>, PeriodChartData<P>
- All Known Implementing Classes:
- JFreeTimeChartData
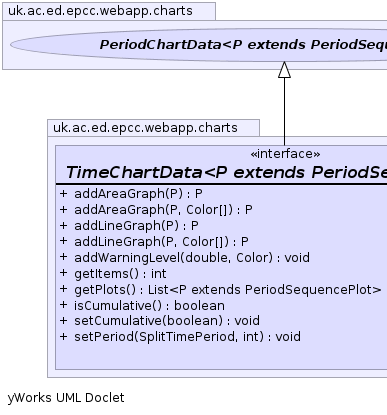
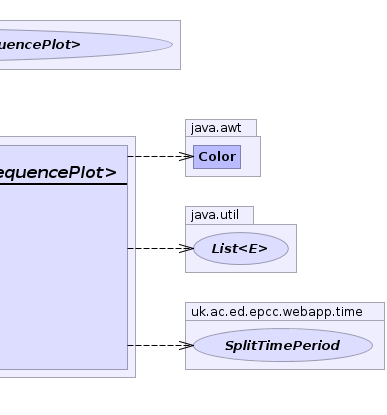
public interface TimeChartData<P extends PeriodSequencePlot>
extends PeriodChartData<P>
A ChartData that represents a TimeChart
-
-
Method Summary
All Methods Instance Methods Abstract Methods Modifier and Type Method and Description PaddAreaGraph(P plot)Add a Plot as an area graph.PaddAreaGraph(P plot, java.awt.Color[] custom_colours)Add a Plot as an area graph with custom coloursPaddLineGraph(P plot)Add a Plot as a line graphPaddLineGraph(P plot, java.awt.Color[] custom_colors)add a Plot as a line graphvoidaddWarningLevel(double value, java.awt.Color col)mark a threshold/warning levelintgetItems()get the number of plot points in the chartjava.util.List<P>getPlots()booleanisCumulative()voidsetCumulative(boolean value)Set a hint that we are going to use this data in a cummulative plotvoidsetPeriod(SplitTimePeriod period, int nsplit)-
Methods inherited from interface uk.ac.ed.epcc.webapp.charts.PeriodChartData
getPeriod
-
Methods inherited from interface uk.ac.ed.epcc.webapp.charts.ChartData
createPNG, createPNG, getQuantityName, getSize, makeDataSet, setGraphical, setQuantityName, setTitle, writeGraphics
-
-
-
-
Method Detail
-
setCumulative
void setCumulative(boolean value)
Set a hint that we are going to use this data in a cummulative plot- Parameters:
value-
-
isCumulative
boolean isCumulative()
-
setPeriod
void setPeriod(SplitTimePeriod period,
               int nsplit)
-
addAreaGraph
P addAreaGraph(P plot)
        throws java.lang.Exception
Add a Plot as an area graph.- Parameters:
plot-- Returns:
- Plot
- Throws:
java.lang.Exception
-
addAreaGraph
P addAreaGraph(P plot,
               java.awt.Color[] custom_colours)
        throws java.lang.Exception
Add a Plot as an area graph with custom colours- Parameters:
plot-custom_colours-- Returns:
- Plot
- Throws:
java.lang.Exception
-
addLineGraph
P addLineGraph(P plot)
        throws java.lang.Exception
Add a Plot as a line graph- Parameters:
plot-- Returns:
- Plot
- Throws:
java.lang.Exception
-
addLineGraph
P addLineGraph(P plot,
               java.awt.Color[] custom_colors)
        throws java.lang.Exception
add a Plot as a line graph- Parameters:
plot-custom_colors-- Returns:
- Plot
- Throws:
java.lang.Exception
-
addWarningLevel
void addWarningLevel(double value,
                     java.awt.Color col)
mark a threshold/warning level- Parameters:
value-col- optional Color to mark threshold with
-
getPlots
java.util.List<P> getPlots()
-
getItems
int getItems()
get the number of plot points in the chart- Returns:
-
-